


美元的不稳定导致越来越多人开始关注比特币,很多人都以为比特币低买高卖,甚至有部分投资者把比特币与股票联系到了一起,其实比特币跟股票是不一样的,比特币是一种P2P形式的虚拟的加密数字货币,而股票是股份公司发行的所有权凭证,不过对两者有所了解的人都知道,想要投资比特币或者股票,都需要使用到一种工具,那就是K线图,也正是因为如此,投资者对于比特币K线图与股票是否一样产生了怀疑。
The instability of the United States dollar has led more and more people to focus on bitcoin, many of whom believe that bitcoin is being bought and sold at a very low price, and even that some investors have linked bitcoin to shares, which are different from stocks, which are a virtual encrypted digital currency in the form of P2P, while shares are title deeds issued by stock companies, although those who know both know that a tool needs to be used to invest bitcoins or shares, that is, the K-line map, and that is why investors have doubts about whether the Bitcoche-K-line map is the same as the stock.
答案是两者还是有区别的,我们都知道股票也有K线,研究股票的K线也是炒股必备的一项工作,很多股市大牛日以继夜地将精力投在分析研究K线走势上。放在数字货币上也是一样,学会乃至深入研究K线,是有利于精准投资的。
The answer is whether there is a difference between the two. We all know that stocks have a K-line, that the K-line for stock research is an essential part of the job, and that many stock market bulls spend day and night analysing K-line trends.
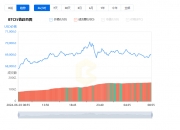
在比特币分时图中,比特币交易量红色一般情况下是代表买入的意思,而比特币交易量绿色则是卖出。在我们实际的操作中,红色量柱的长短意味着买盘的旺盛,绿色量柱的长短意味着卖盘的出货积极,因而市场在快速上涨的时候会伴随着红色量柱的快速增长,在快速下跌的时候也会出现绿色量柱的快速增加,这两者在盘中的纠缠变化也就意味着我们的操作需要随之改变,进行加仓或者是减仓出局。
In the Bitcoins time map, bitcoin transactions typically mean buying, while bitcoin transactions are selling green. In our actual operations, the length of the red column means buying a plate, the length of the green column means selling the plate positively, so that the market increases rapidly with the red column, and the rapid increase of the green column when it falls, and the tangled change in the plate means that our operations need to change, build or reduce.
股票成交量柱状线颜色是根据股票涨跌来的,股票K线收红成交量柱状线也会收红(一般代表股票上涨),股票K线收绿成交量柱状线也会收绿。
The colour of the stock mass column is based on stock growth and falls, while the stock K line has a red line (generally representing a stock increase) and the stock K line has a green line.
股票成交量代表的是股票的交易量,成交量和股价同步运行是良性的,当股价上涨,成交量放大,股票后续上涨的概率较大,当股价上涨,成交量没有放大或者股价不涨,成交量放大,股票后续下跌的概率极大。
The stock exchange represents the stock trade, the turnover and the synchronization of the stock price are benign, the turnover increases, the turnover increases, the probability of subsequent stock increases is greater, the turnover increases, the turnover does not widen or the stock price does not rise, the turnover increases and the probability of subsequent stock declines is very high.
数字货币的K线跟股市的K线也有些许不同,今天我们就从实际操作的角度,教会大家如何看懂数字货币的行情K线。
The K-line of digital currency is also somewhat different from the K-line of the stock market, and today we teach you how to read the K-line of digital currency from a practical point of view.
在这里我们用最具代表性的比特币K线举例说明,素材来自于13日的K线。
Here, we give the most representative example of the Bitcoin K Line, where the material comes from the 13th.
同一数字货币在不同周期内的K线会有区别。以比特币为例,打开比特币的K线图,我们看到的画面是这样的:
The same numeric currency differs from line to line in different cycles. In bitcoin, for example, it opens the K-line map of bitcoin. Here's what we see:

我们可以从上方调整需要观察的周期:
We can adjust the cycle that needs observation from above:

也可以通过左右拖动直接查看,用鼠标滚轮可以放大。
It can also be viewed directly by drags, right or left, and can be magnified by mouse wheels.
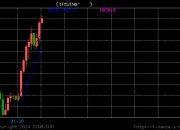
在图中我们可以看到很多的红绿色的柱状体,绿色空心的柱状图表示价格上涨,红色实心的柱状图表示价格下跌。
In the graph we can see a lot of red green columns, green hollow columns that represent price increases, and red solid columns that indicate falling prices.

当一个周期的开盘价低于收盘价,就是价格上涨了,图中会以绿色空心柱体显示;当一个周期的开盘价高于收盘价,就是价格下跌了,图中会以红色实心柱体显示。
When the opening price of a cycle is lower than the closing price, it is higher, and the chart is shown as a green hollow column; when the opening price of a cycle is higher than the closing price, the price falls, and it is shown as a red heart column.
每个周期内柱体的大小长度,代表这个周期内多空两方力量的强弱。绿色柱体越长表示该周期内多方力量强大,价格上涨多,反之红色柱体越长表示该周期内空方力量强大,价格下跌的多。
The length of the cylinders in each cycle represents the strength of both forces in the cycle. The longer the green column is the strength of multiple forces in the cycle, the higher the price is, the longer the red column is the strength in the cycle and the more the price falls.

?Taps1:多方和空方即表示多头方和空头方。多头方指投资者看好,预计价格会上涨时乘低价买入,在上涨到一定程度后抛售,以获取差额收益。空头方指投资者认为现在价格虚高,预计价格会下跌,于是开始抛售,待下跌到一定程度后再低价买入,以获取差额收益。
Taps1: Multiple and empty means multiple head and empty head. Multiple headlines refer to investors who expect a price to rise when it is bought at a lower price, and sell it up to a certain level in order to reap the difference.
?Taps2:虽然多空双方会起到一个启发和警醒的作用,但是也要根据自身情况和经验具体情况具体分析,以免跌入操盘陷阱。
♪ Taps2: While both sides can serve as an inspiration and a wake-up call, they must also be analysed on a case-by-case basis according to their own circumstances and experience, so that they do not fall into the game trap.
在红绿柱体的上下两端,通常会衍生出两条细线,称作影线。影线反应了价格波动的范围。在实体上端的叫上影线,表示最高价;下端的叫下影线,表示最低价。通过上下影线,可以更好地分析多空的趋势,对判断形势有一定提示作用,比如图中过长的下影线和上影线,都应当有一定的风险意识,自我警醒。
At the upper and lower ends of the red-green column, two fine lines are usually derived, called cinematographic lines. Shadow lines reflect the range of price fluctuations. At the upper end of the entity, the call is the upper line, which is the highest price; at the lower end, the call is the lower line, which is the lowest price. Through the upper and lower line, it is possible to better analyse trends that are multi-empty and have some indicative effect on judging the situation, such as the long lower and upper line of the picture, which should have some risk awareness and self-aware.

在K线中我们还能看到横向两条线,分别为白色和黄色。这两根线分别为5周线和10周线,分别代表了近5周和10周内交易成功的平均价格走势。
We can also see two horizontal lines, white and yellow, on line K. The lines are five weeks and 10 weeks, respectively, representing the average price movement of successful transactions in nearly five weeks and 10 weeks, respectively.

在整个图表下方,我们还能看到一组红绿相间的柱形图和其他颜色的横向曲线,这是k线的辅助分析指标,包括成交量、macd、kdj等指标,用来进行交易的技术分析,从而为交易提出参考。
At the bottom of the chart, we can also see a set of columns between red and green and other horizontal curves of colour, which are complementary analysis indicators of the k-line, including turnover, macd, kdj, etc., used for the technical analysis of transactions to inform transactions.

总结:数字货币的K线和股票K线一脉相承,经常投资股票的投资者相信很容易入手,没有炒股经验的投资者,希望在看了本文的讲解之后能够获得一定的启发,当然投资者也可以先做一点很小的投资,了解整个行业是如何运作的,在正式投资之前可以给你更好的启发。
Summing up: The K-line of digital currency and the K-line of stock, the fact that current investors believe that it is easy to do, and the fact that there is no stock-breeding experience, would like to see some inspiration from the presentation. Of course, investors could make a small investment first, knowing how the entire industry works, and could give you a better insight before making a formal investment.
注册有任何问题请添加 微信:MVIP619 拉你进入群

打开微信扫一扫
添加客服
进入交流群


发表评论